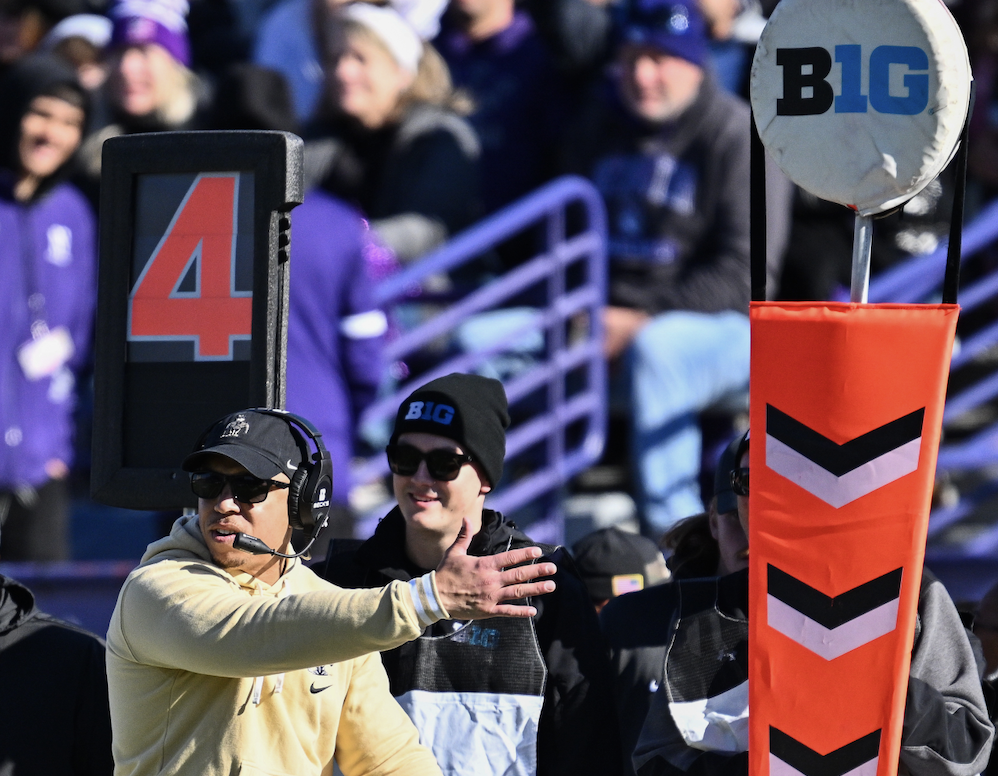
The use of analytics has become widespread in both college and professional football. While the use of data is often debated among media members and fans, all teams use numbers to make decisions in some way, shape, or form.
One way teams use historical data is when deciding whether to punt, kick, or go for it on fourth down. So, what kind of analytics information is included in fourth-down decisions?

What Type of Data is Used in Fourth-Down Decisions?
Coaches have access to dozens of relevant data points when it comes to making decisions on fourth down. Fans and media members usually have a bit less information on hand, but still plenty that can give insight into a team’s decision to punt, kick a field goal or leave the offense on the field.
The end goal is to maximize win probability.
Win probability simply refers to the chance a team has of winning at a certain point in the game. A coach’s goal is to maximize win probability through decision-making. As explained previously, pre-snap win probability is impacted by both the chance a decision succeeds and the impact of the play’s potential success or failure.
To make informed decisions, coaches rely on data.
MORE: What Are College Football Analytics?
The main types of information that go into fourth-down decisions include historical data, game situations, offensive and defensive strengths, and more.
As fans and media members, we have access to much of this data. Ben Baldwin’s fourth-down decision model has been adapted by Jared Lee for the college game using cfbfastr’s win probability model.
This model uses situational probabilities based on the following inputs: Score, time remaining, fourth down distance, distance from end zone, timeouts remaining, home and away, Vegas pre-game spread and over/under, and which team receives the second half kickoff.
All of these factor into the decision. The score, time, and distance should be obvious, but all of the other factors are important as well. A high over/under typically means the difference between a field goal and a touchdown on a drive is more important and the chances of defenses getting stops is lower. The spread shows how well the teams are expected to perform.
These inputs all change the expected win probability of each decision. Coaches have access to all of this and more, including weather, injuries, expected play call, and their own historical data, all of which are hard to account for in a universal model.
Models may vary from outlet to outlet based on how each of the factors are weighed, but most models are generally in line with one another most of the time.
Why Do Coaches Use Analytics?
Over the past decade, college football has seen an uptick in the frequency with which coaches leave the offense on the field on fourth down. A large part of that is that more teams are using data and realizing that the average coach is too conservative when it comes to making fourth-down decisions.
The use of analytics is driving some coaches to become more aggressive in hopes of creating a competitive advantage over the competition. Models simply use numbers to quantify the decisions rather than forcing coaches to rely exclusively on their own intuition.
By using analytics, college football coaches can create competitive advantages that allow them to make the most informed decisions in key situations.
Miss any action from the top college QB Rankings during the 2023 football season? Want to track all the movement with the college football’s transfer portal? College Football Network has you covered with that and more!

